Self-directed · AI-assisted · React · 2026
Operations
Dashboard
The business outgrew its spreadsheets. This replaced them with one place that handles inventory and bookkeeping together.
- Replaces
- Spreadsheets
- Scope
- Solo build
- Tracks
- Inventory / sales / expenses / profit
- Saved
- Dozens of hours
Problem
Every purchase decision ran through a spreadsheet: slow to enter, hard to visualize, and no effective way to track bulk sales. At the volume the business was doing, that was costing valuable time.
Build
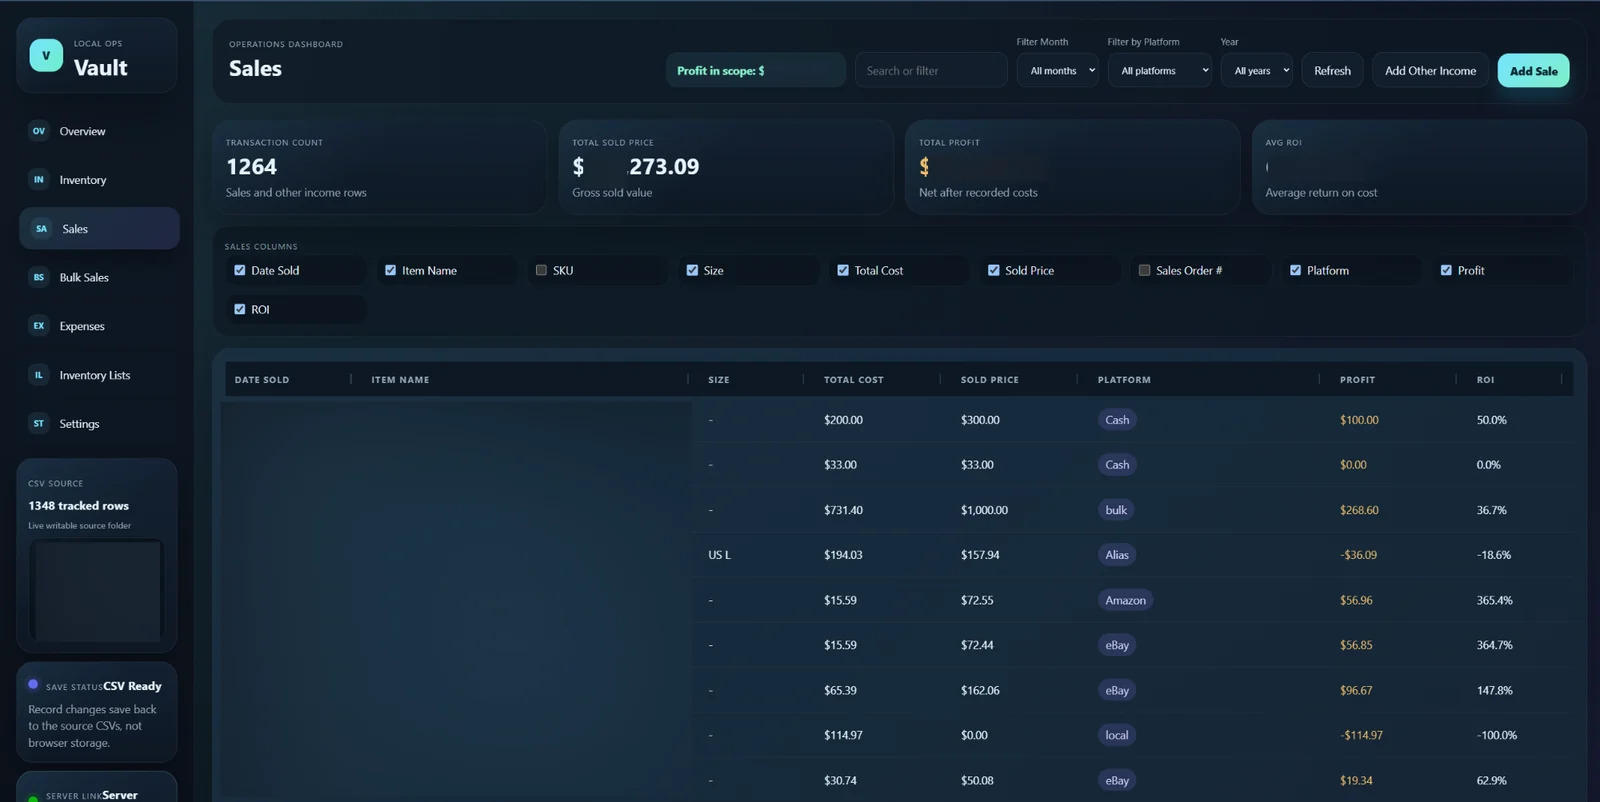
I built a React dashboard for every sale, combining inventory, expenses, individual and bulk sales, revenue, and profit tracking. Streamlined entry came first, since that was the bottleneck, followed by calculated margin and profitability tracking.
Data
CSV files serve as the application's primary datastore, which keeps the records portable, easy to back up, and directly auditable outside the application. If the dashboard ever went away, the business's books would still open in any spreadsheet program.
Checking the math
I used Codex throughout development and built a regression checker that verifies the financial calculations after every code change. It covers:
- Cent-level total cost calculations, including tax and shipping
- Net profit
- Percentage ROI
- Cost allocation for bulk-lot items
- Legacy CSV imports that lack explicit total-cost fields
- Separation of same-day bulk sales for different buyers
- Persistence of user-entered formulas through save/load round trips
Result
Data entry stopped being the reason to delay logging a purchase, margin across high-volume bulk sales became visible, and the fragmented spreadsheets went away, saving dozens of hours of manual work.